A Python Script to Trace Eruption History of Volcanic Sites Using Satellite Imagery.
Detecting scenes with potential Thermal anomalies from the bulk of Sentinel-2 data using the Normalized Hotspot Index (NHI)
Project Description:
This project presents a custom Python script built on the Google Earth Engine (GEE) API to trace volcanic activity from historic
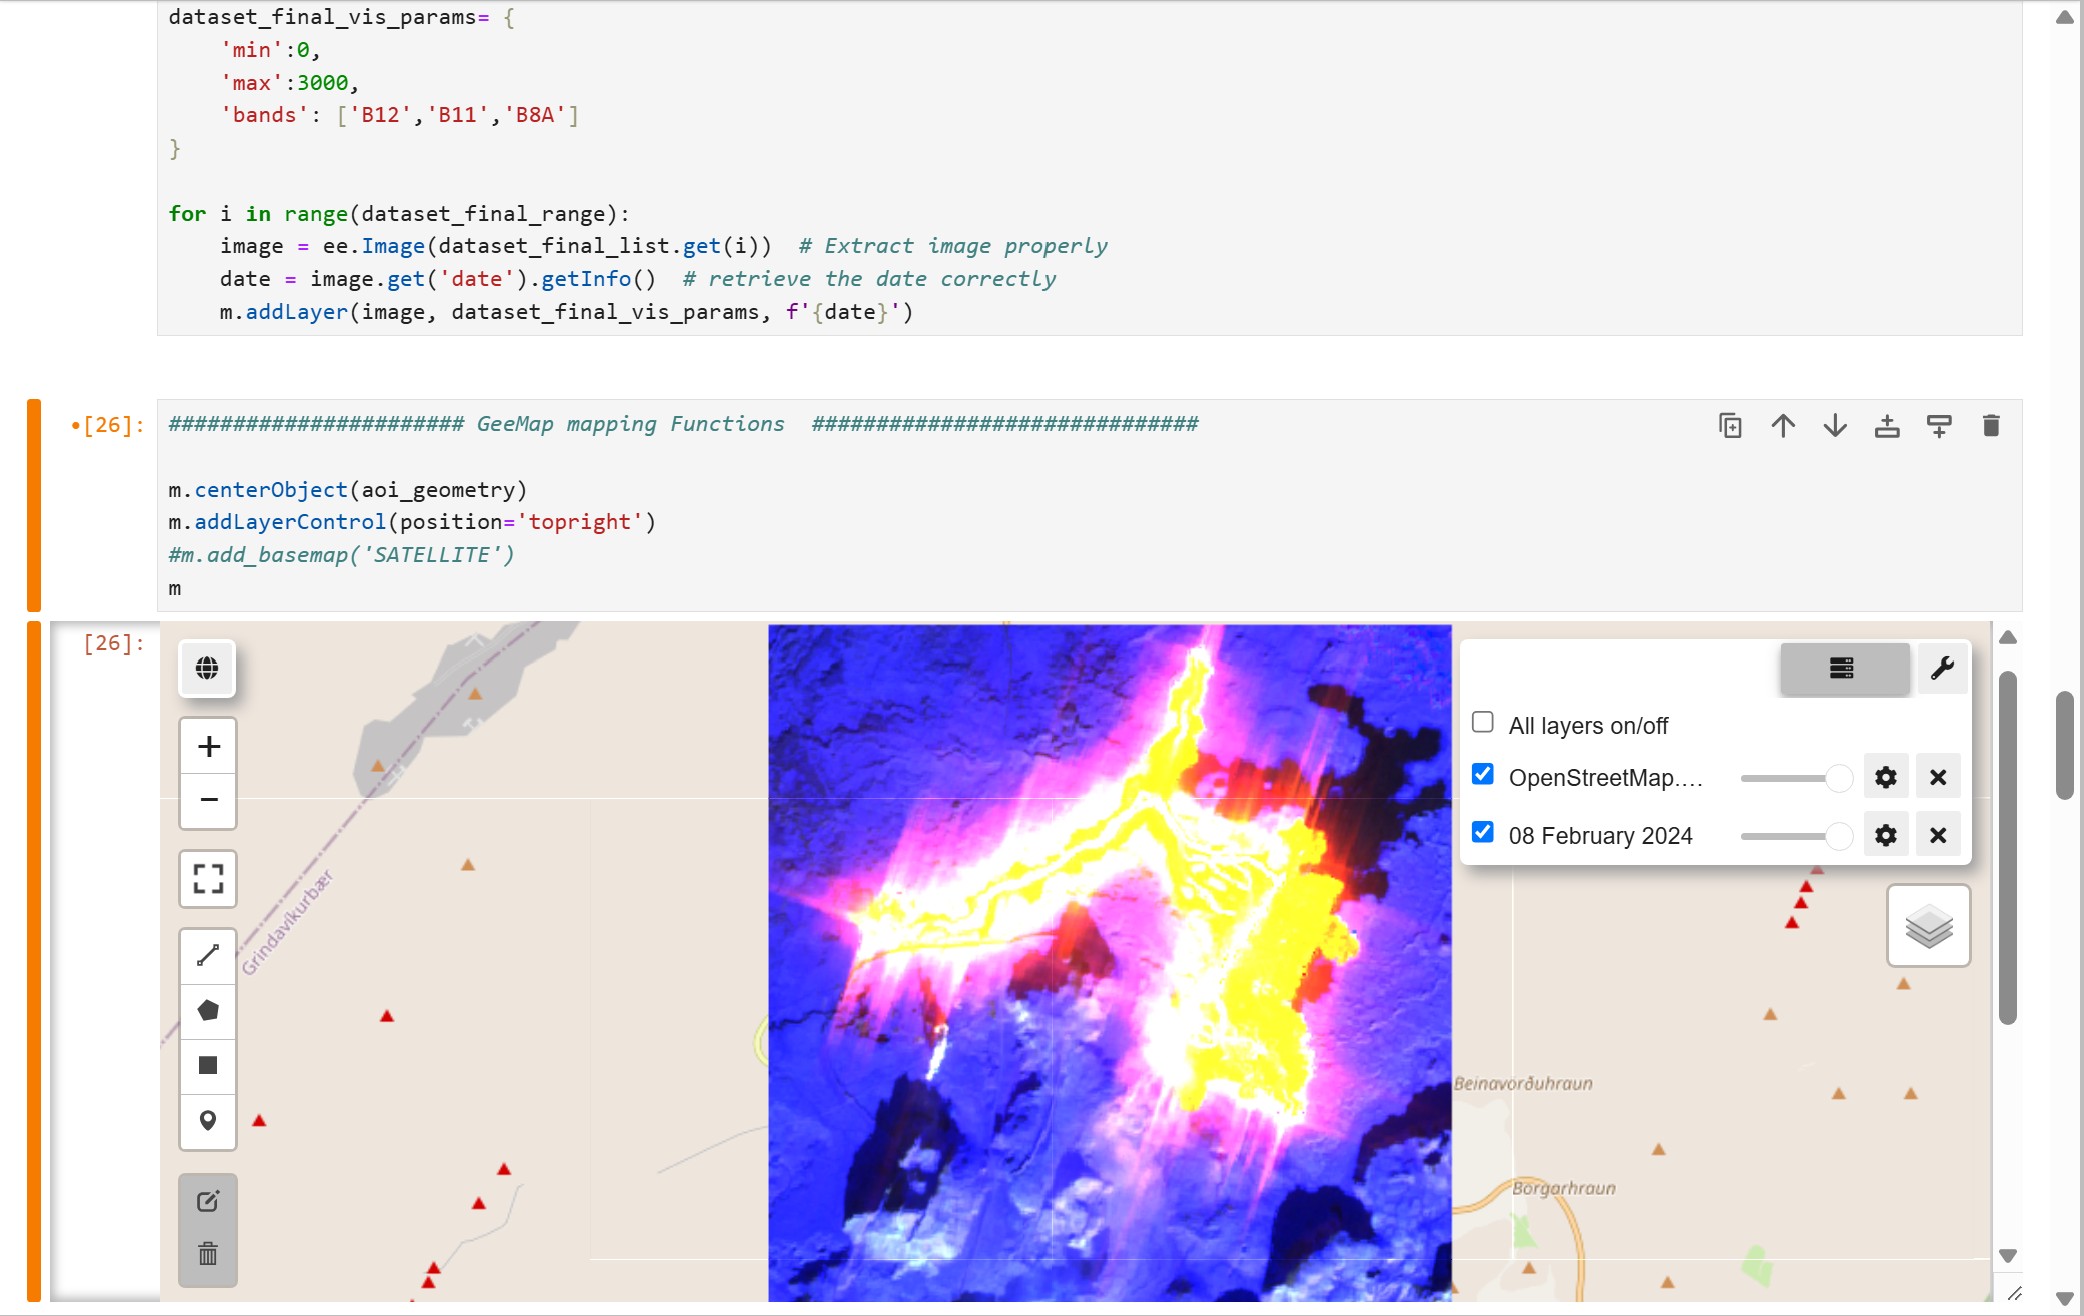
Sentinel-2 satellite data for a region of interest. It calculates the Normalized Hotspot Index (NHI) based on the method proposed by Marchese et al. (2019) using the SWIR and NIR bands of Sentinel-2 (B12, B11, B8A). By simply setting the (i) Site location, (ii) Date range, and (iii) NHI threshold, the workflow filters images with potential thermal anomalies associated with volcanic activity and helps visualise a timeline of eruption history for that site.
The script was run for several volcanic sites in Iceland (2020–2024) and the results are included in a detailed ArcGIS StoryMap highlighting time-series visualization of key eruption zones showcasing spatial patterns and impacts.
Data processing and filters used in the script include:
i) Loading Sentinel-2 Level 1C dataset (Top-of-atmosphere reflectances).
ii) Clipping dataset to Area of Interest (AOI).
iii) Attaching acquisition dates to each image.
iv) Converting reflectance to radiance for bands of interest (Because thermal energy is best measured as emitted energy, not reflected sunlight).
v) Calculating and Adding NHI index Bands.
vi) Filtering scenes with Maximum B12 Radiance > 2 (Discriminates volcanic activity from cooler surfaces & Reduces false positives.
vii) Filtering scenes using a threshold NHI value between -1 and 1 with values > 0 indicating thermal hotspots (Use higher values to minimize false positives, eg. 0.2).
Reference: Marchese, F., Genzano, N., Neri, M., Falconieri, A., Mazzeo, G. and Pergola, N., 2019. A multi-channel algorithm for mapping volcanic thermal anomalies by means of Sentinel-2 MSI and Landsat-8 OLI data. Remote Sensing, 11(23), p.2876.
Team Members:
Joyson Estibeiro
Affiliation:
Personal Project
Team Members:
Joyson Estibeiro
Affiliation:
Personal Project